 Setting up apparatus
 Video capture & tracking
 Observing behaviour
 Connecting equipment
 Automating complex tests
 Running tests
 Results
 Visualising data
 Analysis
 Transferring data
 Open field
 Water-maze
 Y-maze
 Fear conditioning
 Novel object
 Barnes maze
 Radial arm maze
 Light/dark box
 Operant conditioning
 Zebrafish
 Computers
 Multifunction remote
 Accessories
 Digital interface
 Optogenetic interface
 Synchronisation interface
 Relay interface
 Audio interface
 Touch interface
 Analogue interface
 USB TTL cable
 Animal shocker
 Components
 Place preference
 ANY-box
 T-maze
 Zero maze
 Hole board
 Sociability cage
 OPAD
OPAD RAPC
RAPC Waterwheel forced swim test
 Thermal gradient ring
 Operon
 Activity Wheel
 Full ANY-maze licence
 Other licence types
 Developing countries licence
 Contact support
 Support Policy
 FAQs
FAQs Guides
 Downloads
 Send us files
 Activate a licence ID
 Documentation
 Contact us
 Blog
Blog About
About Testimonials
 Privacy Policy
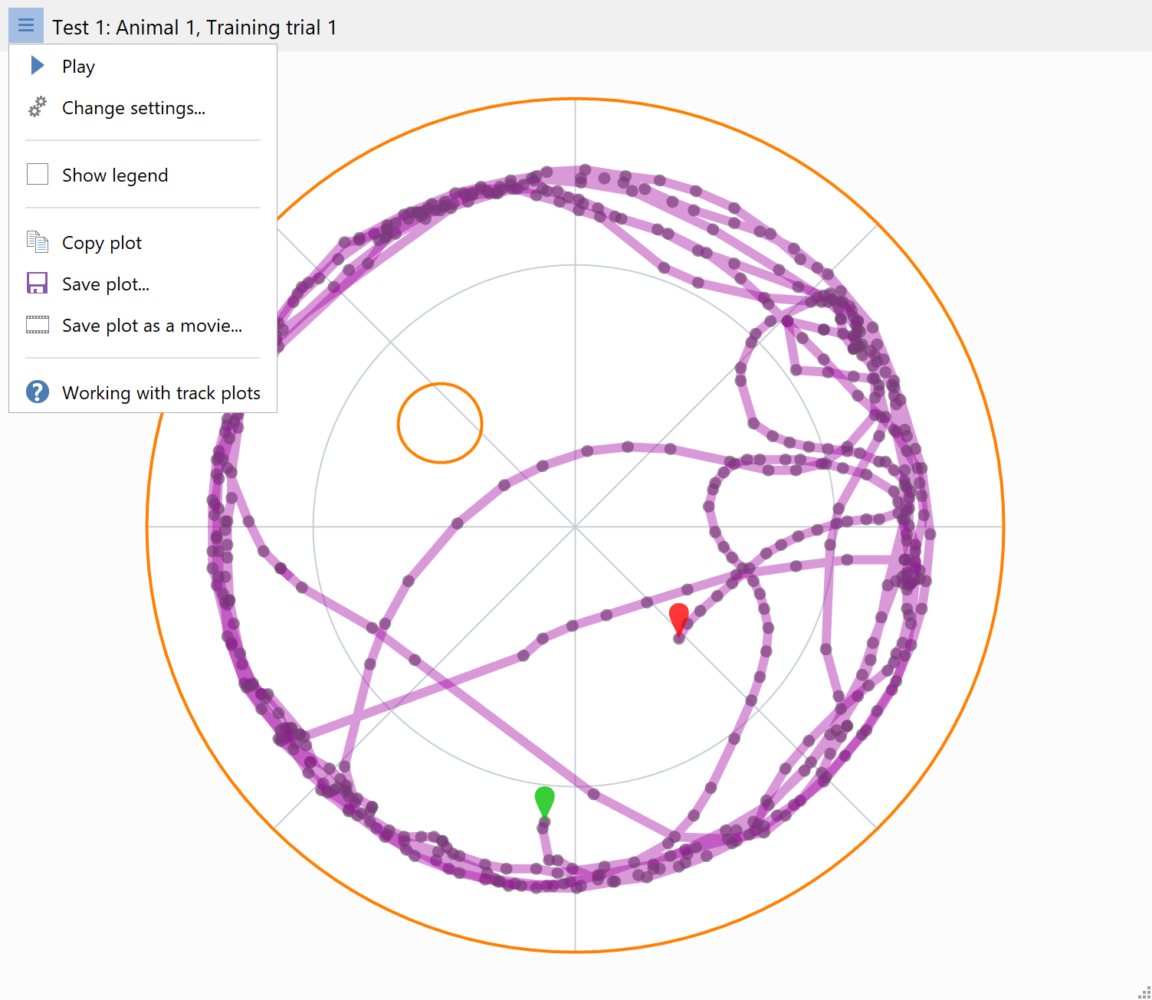
Track plots
Track plots show you where the animal went during the test and can plot either the track of the animal’s centre or its head.
The tracks can be colour coded, for example to show how fast the animal is moving and the plot can include markers where specific things occurred, for example, where the animal froze, or where a particular behaviour, such as grooming occurred.
Plots can be played-back, either at real-time speed or faster or slower, and can easily be recorded to a video file for inclusion in a presentation.
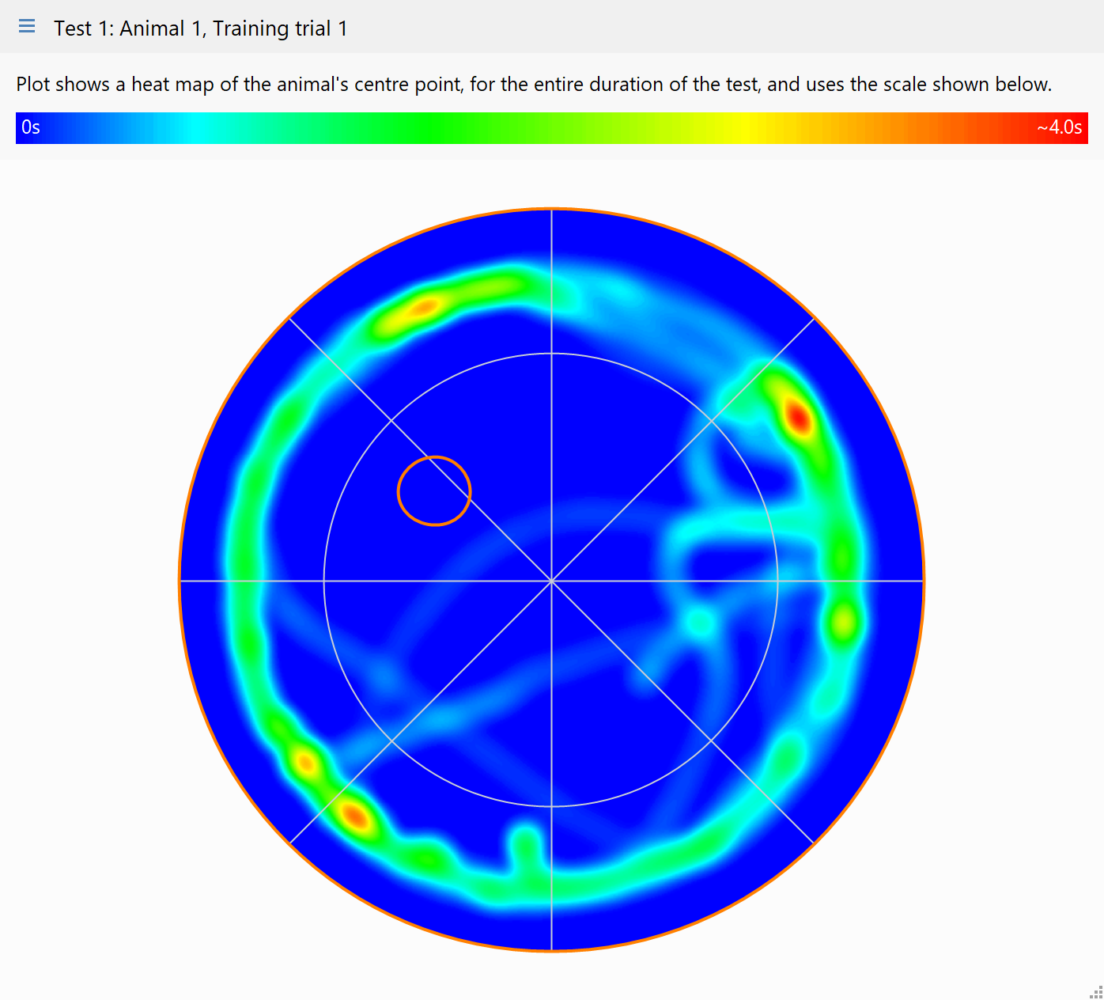
Heat maps
Heat maps typically show where the animal spent the most time, however, they can be used to show where any activity occurred – for example, where grooming was most prevalent.
The maximum value, shown in red, is normalised across all tests in an experiment, making it easy to compare heat maps, but you can set it to a specific value, which makes it possible to compare tests between experiments.
Average heat maps, for groups of animals, can be created – with transforms being applied, if required, to make the data for all the test consistent. For example, if the platform in a water-maze was in the top-left for some tests and in the bottom-right for others, rotating the data for the bottom-right tests by 180° would make it possible to generate an average heat map for all the tests.
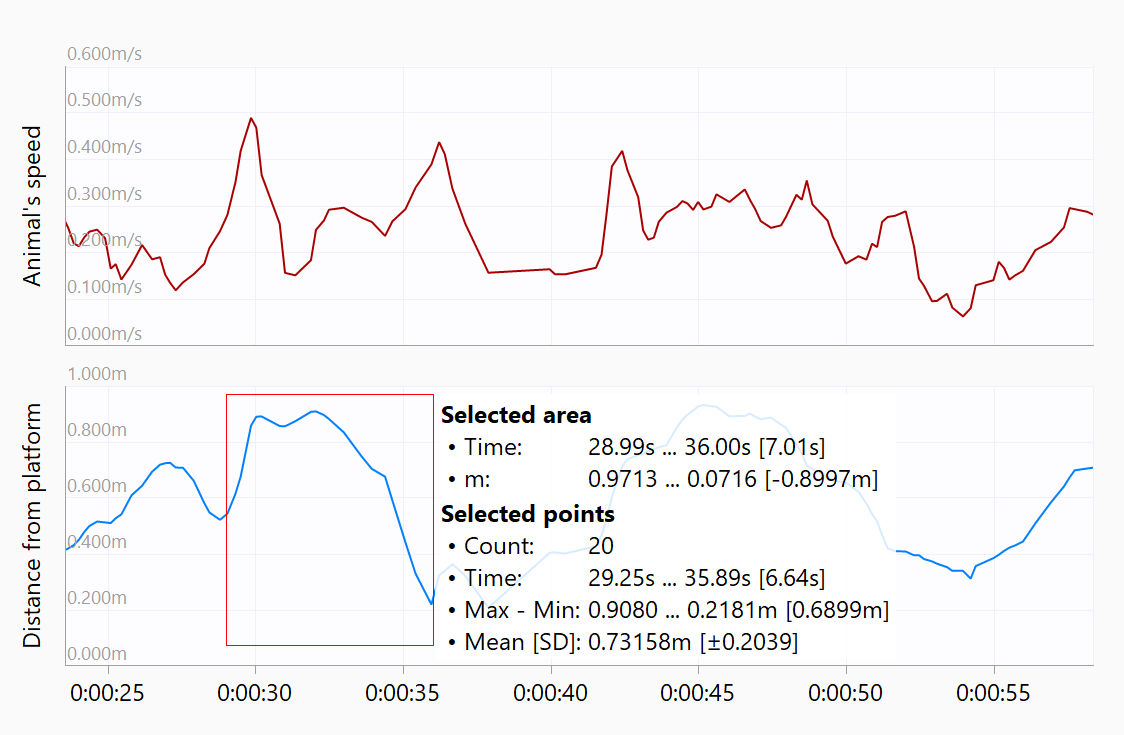
Charts
Charts provide a way to visualise how the animal’s behaviour altered across the duration of the test, with the option to plot more than forty different parameters.
It’s easy to zoom in on any part of a chart and to take measurements of the plotted data, for example, to see precisely what value a peak represents, or to measure the width of a dip.
Track plot features
- Plot the position of the animal's centre or head
- Optionally colour-code the track based on time, the animal's speed, etc.
- Include markers to indicate where specific behaviours occurred, such as the animal freezing
- Plot the entire duration, or any sub-section of the test
- Create multiple plots each showing a part of the test
- Optionally draw the plot over a picture of the apparatus
- Copy plots to the clipboard or save them in a variety of formats
- Resize plots
- Play plots
- When playing a plot only show the track and markers for a certain duration
- Save plot-playback as a video in a variety of formats
Heat map features
- Show heat maps of the position of the animal's centre or head
- Show heat maps of any behaviour
- Heat map maximum is set automatically but can be adjusted manually
- Show the entire duration of the test
- Show just a specific period of the test
- Create average heat maps for groups of animals
- Apply geometric transforms to tracks so they align and can be averaged
Chart features
- Chart over forty different parameters
- Show the state of binary parameters on the background of a chart - for example whether the animal is in a certain zone
- Roll the mouse wheel to zoom in or out of charts
- Select an area of a chart to zoom in
- Copy charts to the clipboard or save them in a variety of formats
- Easily measure data directly from a chart
- Copy measurements directly to the clipboard
