 Setting up apparatus
 Video capture & tracking
 Observing behaviour
 Connecting equipment
 Automating complex tests
 Running tests
 Results
 Visualising data
 Analysis
 Transferring data
 Open field
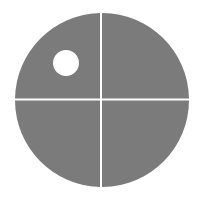 Water-maze
 Y-maze
 Fear conditioning
 Novel object
 Barnes maze
 Radial arm maze
 Light/dark box
 Operant conditioning
 Zebrafish
 Computers
 Multifunction remote
 Accessories
 Digital interface
 Optogenetic interface
 Synchronisation interface
 Relay interface
 Audio interface
 Touch interface
 Analogue interface
 USB TTL cable
 Animal shocker
 Components
 Place preference
 ANY-box
 T-maze
 Zero maze
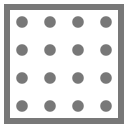 Hole board
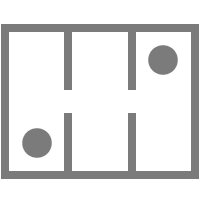 Sociability cage
 OPAD
OPAD RAPC
RAPC Waterwheel forced swim test
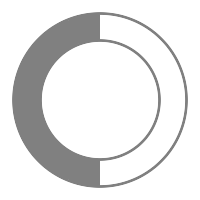 Thermal gradient ring
 Operon
 Activity Wheel
 Full ANY-maze licence
 Other licence types
 Developing countries licence
 Contact support
 Support Policy
 FAQs
FAQs Guides
 Downloads
 Send us files
 Activate a licence ID
 Documentation
 Contact us
 Blog
Blog About
About Testimonials
 Privacy Policy
To automate Zebrafish experiments, you need reliable tracking and a robust set of tools for analysis
ANY-maze can track both zebrafish larvae and adults and provides hundreds of results including distance travelled, speed, mobility, time in zones, etc.
Use the tabs below to learn more. We've included some videos of real zebrafish tests, so you can see the system in action, as well as details of recommended equipment, such as suitable cameras, and a list of results that are especially useful in this test.
Track multiple animals simultaneously
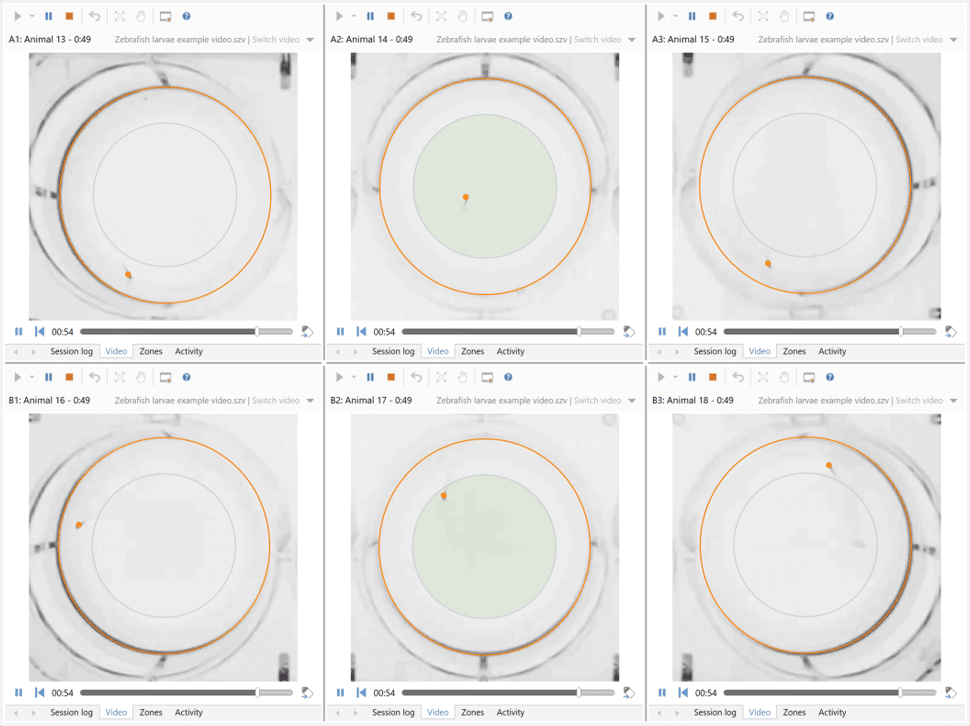
Increase your throughput by tracking in up to 48 apparatus simultaneously, either live or from pre-recorded videos. This is especially valuable when using multi-well plates.
Tests in each apparatus can be run independently, or you can choose to start or stop test in all apparatus at once.
Analyse behaviour in different zones
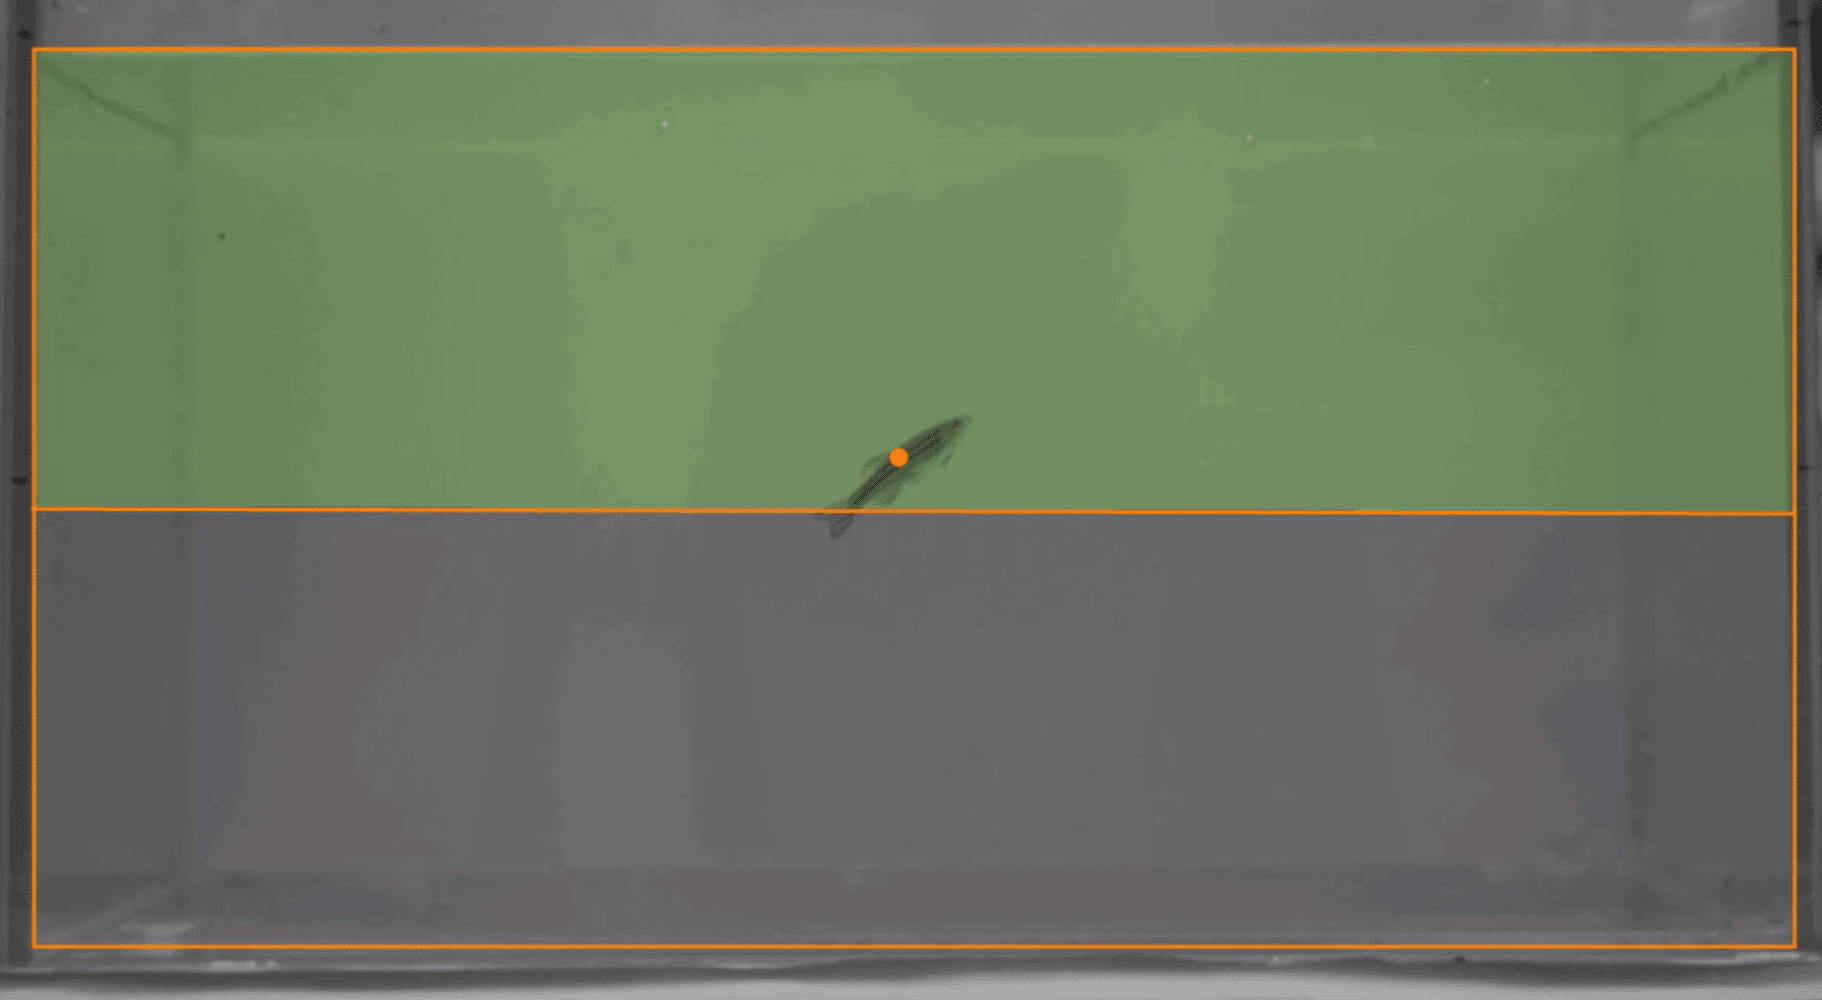
In ANY-maze you define zones that are specific to how you want to perform tests in your apparatus – nothing’s prescribed.
For example, in the apparatus shown here, zones have been set up to score how much time the animal spends in the perimeter vs. the centre.
In fact, for every zone ANY-maze reports more than 60 different measures, so you’ll learn much more than just how long the animal spent in each location. And best of all, you can add, edit or remove zones at any time, even after tests have been performed, without needing to retrack the tests.
Follow an intuitive test schedule
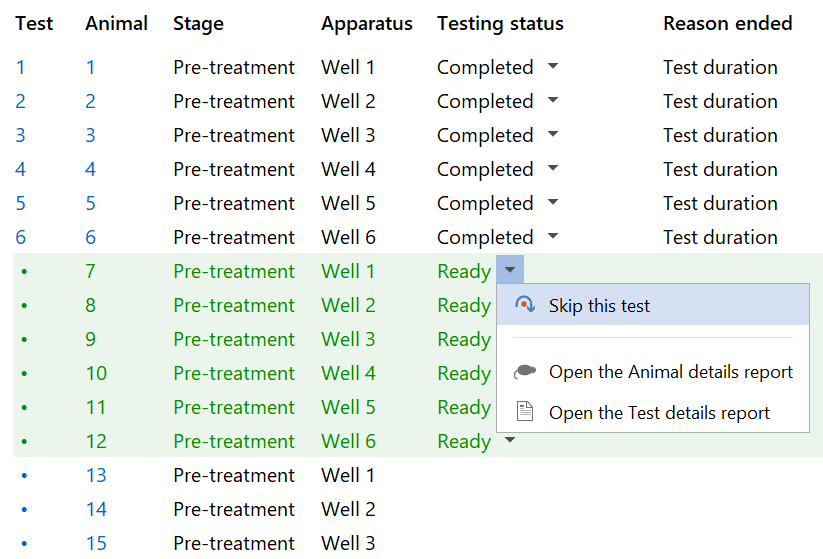
ANY-maze automatically maintains a schedule showing the status of all the tests in your experiment.
Break an experiment into multiple stages containing repeated trials – for example, Pre-treatment and Post-treatment.
The schedule is flexible – select the order, skip tests, retire animals, or just add tests as you go along.
View the animal's track
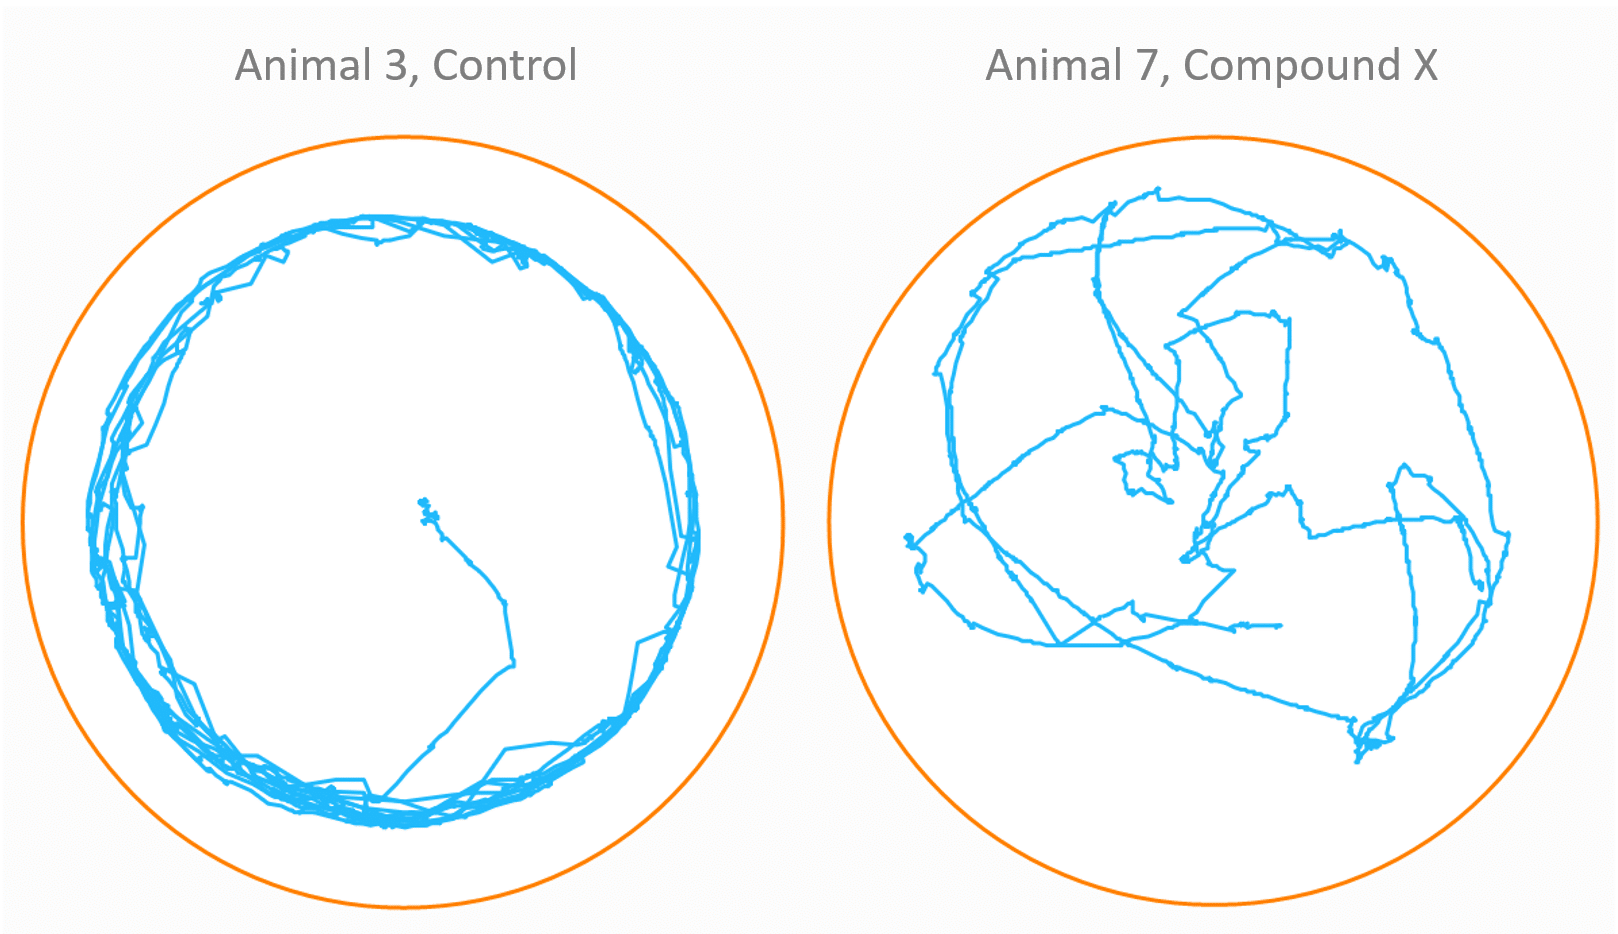
ANY-maze makes it easy to view track plots (or heat maps) of tests for a qualitative assessment of behaviour.
Plots can be tailored to your requirements, perhaps to show just a certain part of the test, or to highlight sections where the animal was moving quickly.
Track plots can be exported for presentation, either as bitmap or vector images, or as videos.
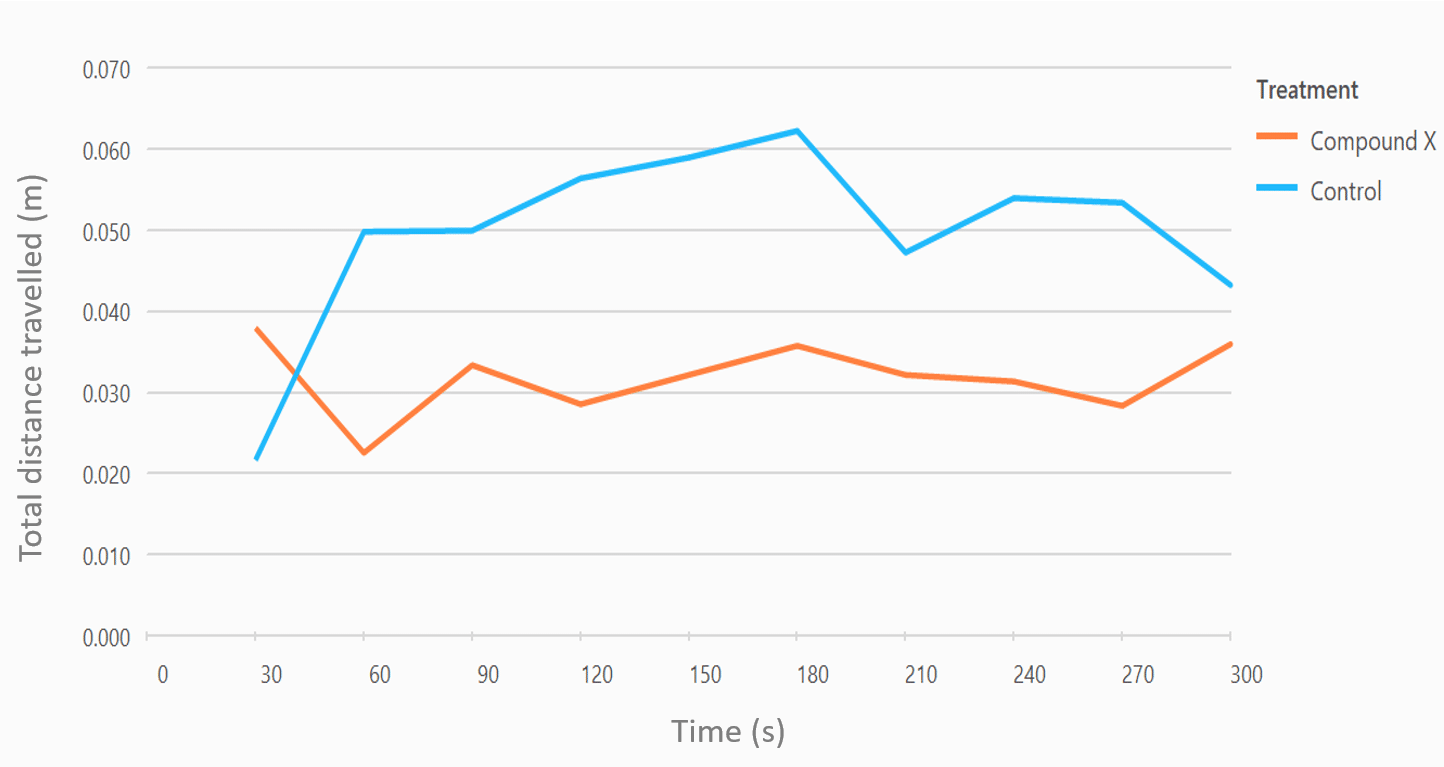
Easily analyse results
You can perform statistical analysis and generate graphs directly from within ANY-maze. As shown in the image to the right, you can also analyse data across time, or choose a custom time period for analysis – you’re not restricted to evaluate only the full test duration.
And as you perform more tests, these analysis tools will update in real time so you can quickly assess how your experiment is progressing.
Results
ANY-maze can provide hundreds of results for any test, but some that are particularly useful in zebrafish experiments include:
- Total distance travelled
- Average speed
- Average Y position (average depth)
- Number of zone entries
- Time spent in a zone
- Latency to enter a zone
- Distance travelled in a zone
- Time spent mobile
- Time spent moving faster (or slower) than a certain speed

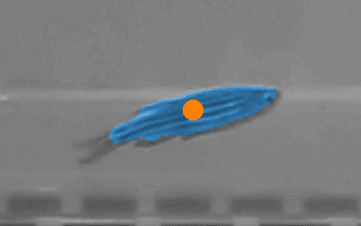
Tracking adult zebrafish
In this example, ANY-maze is tracking an adult zebrafish in an open field and determining the time it spends in the top versus bottom halves of the tank.

Tracking larvae in a 6-well plate
In this video, ANY-maze is tracking six zebrafish larva in a multi-well plate.
Each well has been divided into a centre and perimeter zone, with the centre zone being highlighted when the animal is in it.
ANY-maze can track in as many as 48 apparatus simultaneously.
Cameras
USB Camera
The ANY-maze USB camera is an excellent choice for tracking zebrafish adults or larvae. We recommend fitting this camera with a varifocal (zoom) lens, so you can zoom in and out until the tank or well plate nicely fits the camera's view.
Learn more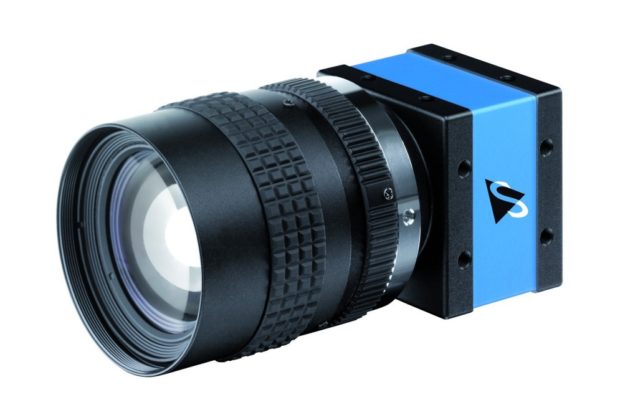
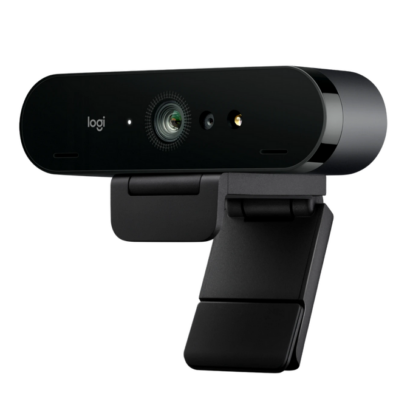
Web cam
A webcam provides an inexpensive alternative to the ANY-maze camera. If you intend to test in normal lighting conditions (>= 100 lux), then a webcam should work well.
Muduli, N., et al (2023). Saffron stigma extract and crocin play an important neuroprotective role in therapeutic measures against benzo[a]pyrene-induced behavioral alterations in zebrafish. Drug and Chemical Toxicology, 47(1), 131-142.
Kaur, K., et al (2023). Glabridin mitigates TiO2NP induced cognitive deficit in adult zebrafish. Neurochemistry International, 169, 105585.
Aparna, S. and Patri, M. (2023). Lactobacillus rhamnosus GG treatment potentiates ethanol-induced behavioral changes through modulation of intestinal epithelium in Danio rerio. International Microbiology, 26, 551-561.
Jorge, S., et al (2023). Housing conditions affect adult zebrafish (Danio rerio) behavior but not their physiological status. Animals, 13(6), 1120.
Tamagno, W. A., et al (2023). Household based-pyrethroids on adult zebrafish (Danio rerio) exert behavioral and cholinergic changes in different brain regions. NeuroToxicology, 96, 19-27.
Sarangi, P., et al (2023). Di-2-ethylhexyl phthalate-induced neurobehavioural transformation is associated with altered glutathione biosynthesis and neurodegeneration in zebrafish brain. Fish Physiology and Biochemistry, 49, 501-514.
Santos, N., et al (2023). Effects of environmental concentrations of caffeine on adult zebrafish behaviour: a short-term exposure scenario. Environmental Science and Pollution Research, 30, 63776-63787.
Alef, R. and Blaser, R. E. (2023). Social group during housing and testing modulates the effect of ethanol on zebrafish (Danio rerio) behavior. Behavioural Processes, 209, 104877.
Alves, C., et al (2023). Cannabis sativa-based oils against aluminum-induced neurotoxicity. Scientific Reports, 13, 9813.
Resmim, C. M., et al (2023). Assessing the exploratory profile of two zebrafish populations: Influence of anxiety-like phenotypes and independent trials on homebase-related parameters and exploration. Behavioural Processes, 210, 104912.
Tamagno, W. A., et al (2022). Neuroprotective and antioxidant effects of pitaya fruit on Cu-induced stress in adult zebrafish. J. Food Biochem., 46(7).
Adedara, I. A., et al (2022). Induction of aggression and anxiety-like responses by perfluorooctanoic acid is accompanied by modulation of cholinergic- and purinergic signaling-related parameters in adult zebrafish. Ecotoxicology and Environmental Safety, 239(1), 113635.
Marcon, M., et al (2022). What do male and female zebrafish prefer? Directional and colour preference in maze tasks. European Journal of Neuroscience, 56(5), 4546-4557.
Kaur, K., et al (2022). AlCl3 induced learning and memory deficit in zebrafish. NeuroToxicology, 92, 67-76.
Borba, J. V., et al (2022). Influence of acute and unpredictable chronic stress on spatio-temporal dynamics of exploratory activity in zebrafish with emphasis on homebase-related behaviors. Behavioural Brain Research, 435, 114034.
Pradhan, L. K., et al (2022). Suppression of Chronic Unpredictable Stress-Persuaded Increased Monoamine Oxidase Activity by Taurine Promotes Significant Neuroprotection in Zebrafish Brain. Neurochemical Research, 48, 82-95.
Valadas, J., et al (2022). Ochratoxin A induces locomotor impairment and oxidative imbalance in adult zebrafish. Environmental Science and Pollution Research, 30, 21144-21155.
Fortuna, M., et al (2022). Exposure to levonorgestrel-based birth control pill in early life and its persistent effects in zebrafish. Environmental Toxicology and Pharmacology, 96, 104006.
Valu, M.-V., et al (2021). Effects of the Hydroethanolic Extract of Lycopodium selago L. on Scopolamine-Induced Memory Deficits in Zebrafish. Pharmaceuticals, 14, 568.
Garbinato, C., et al (2021). Investigation on the Anticonvulsant Potential of Luteolin and Micronized Luteolin in Adult Zebrafish (Danio rerio). Neurochemical Research, 46, 3025-3034.
Sahoo, P., et al (2021). Chronic bisphenol A exposure induces temporal neurobehavioral transformation and augmented chromatin condensation in the periventricular gray zone of zebrafish brain. Drug and Chemical Toxicology, 45(6), 2794-2803.
Dumitru, G. et al (2019). Agathisflavone isolated from Schinus polygamus (Cav.) Cabrera leaves prevents scopolamine-induced memory impairment and brain oxidative stress in zebrafish (Danio rerio). Phytomedicine, 58, 152889.
Todirascu-Ciornea, E. et al (2019). Schinus terebinthifolius essential oil attenuates scopolamine-induced memory deficits via cholinergic modulation and antioxidant properties in a zebrafish model. Evidence-Based Complementary and Alternative Medicine, 2019.