 Setting up apparatus
 Video capture & tracking
 Observing behaviour
 Connecting equipment
 Automating complex tests
 Running tests
 Results
 Visualising data
 Analysis
 Transferring data
 Open field
 Water-maze
 Y-maze
 Fear conditioning
 Novel object
 Barnes maze
 Radial arm maze
 Light/dark box
 Operant conditioning
 Zebrafish
 Computers
 Multifunction remote
 Accessories
 Digital interface
 Optogenetic interface
 Synchronisation interface
 Relay interface
 Audio interface
 Touch interface
 Analogue interface
 USB TTL cable
 Animal shocker
 Components
 Place preference
 ANY-box
 T-maze
 Zero maze
 Hole board
 Sociability cage
 OPAD
OPAD RAPC
RAPC Waterwheel forced swim test
 Thermal gradient ring
 Operon
 Activity Wheel
 Full ANY-maze licence
 Other licence types
 Developing countries licence
 Contact support
 Support Policy
 FAQs
FAQs Guides
 Downloads
 Send us files
 Activate a licence ID
 Documentation
 Contact us
 Blog
Blog About
About Testimonials
 Privacy Policy
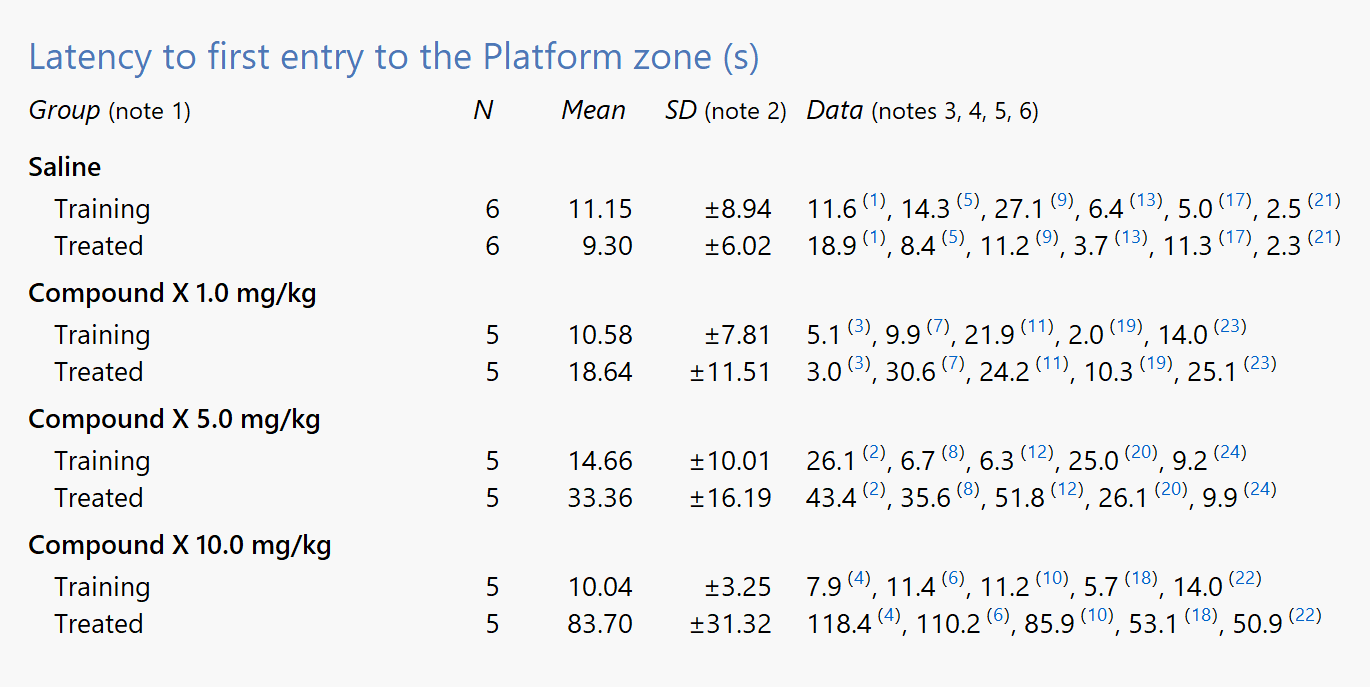
Group and format results
Because ANY-maze understands the structure of your experiment, it’s able to organise your results and present them in an intuitive way.
Of course, you’re in control, so you can group the results in any way you wish. You can filter tests and you can choose what’s displayed – for example, you could replace the SD with the SEM.
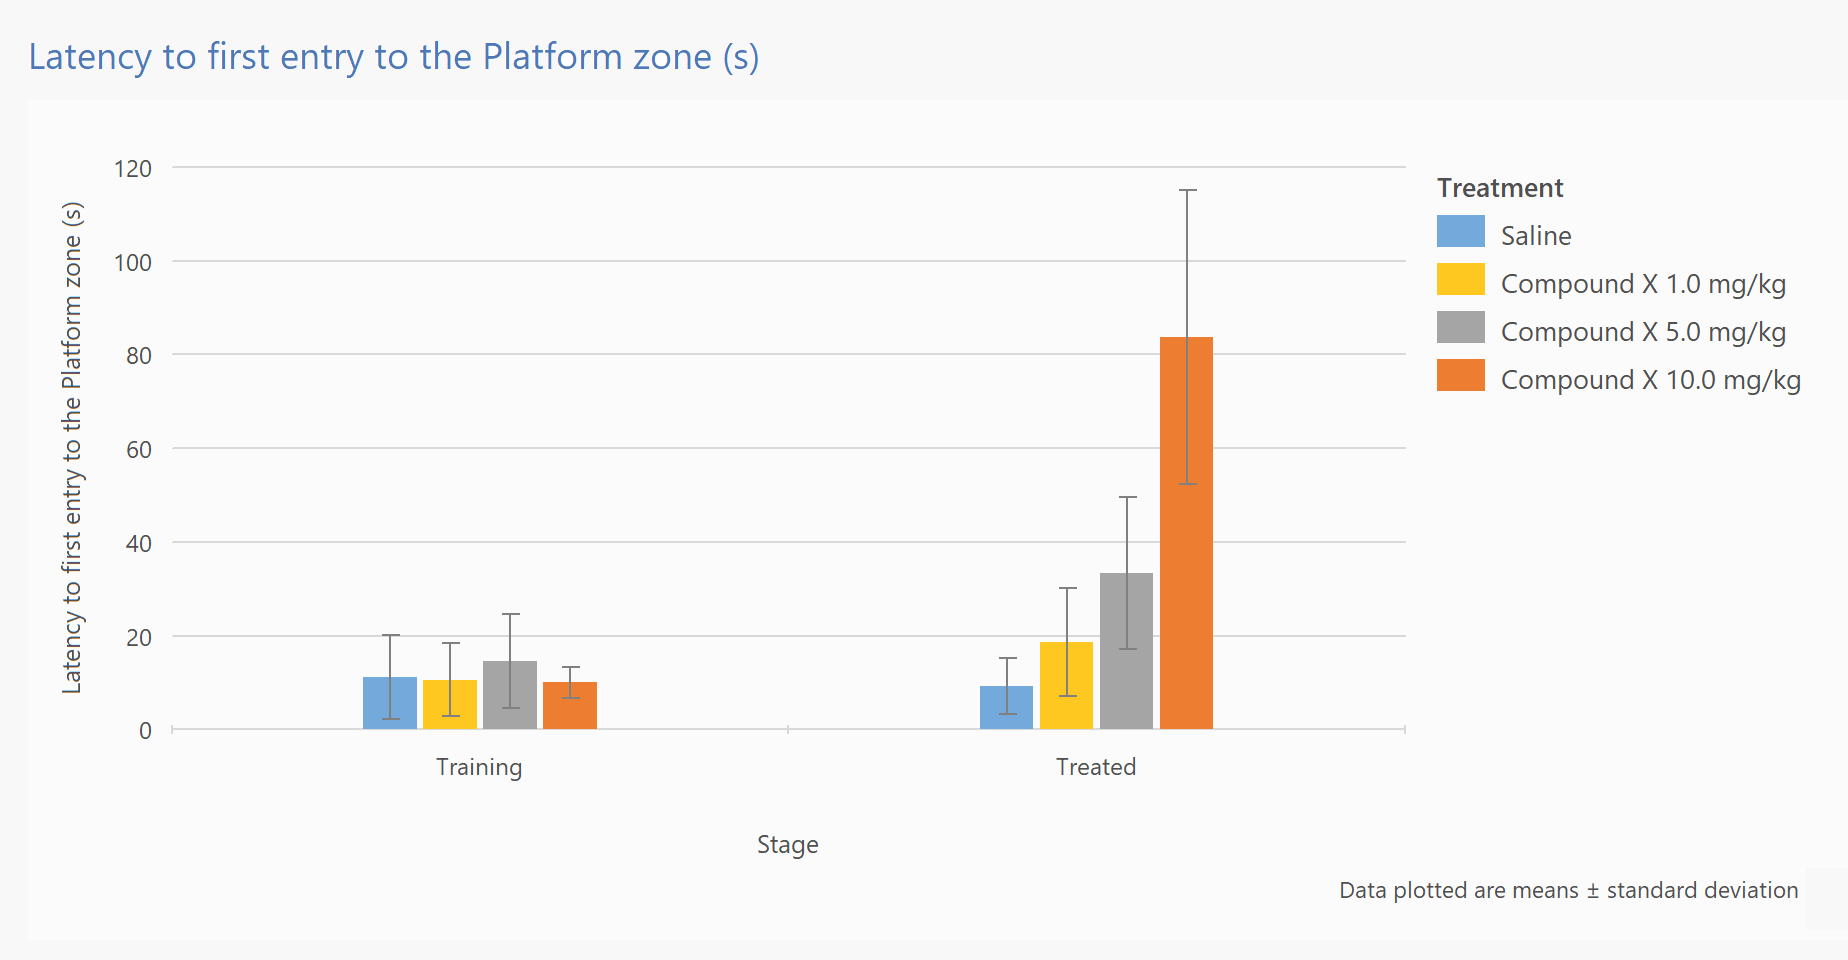
Plot results as graphs
With a single click you can transform a text report, like the one shown above, to a graph like the one shown here.
And ANY-maze doesn’t only create column graphs – it can plot results across time using line graphs and show distributions using scatter plots. Naturally, you can change the colours, alter the error bars, etc.
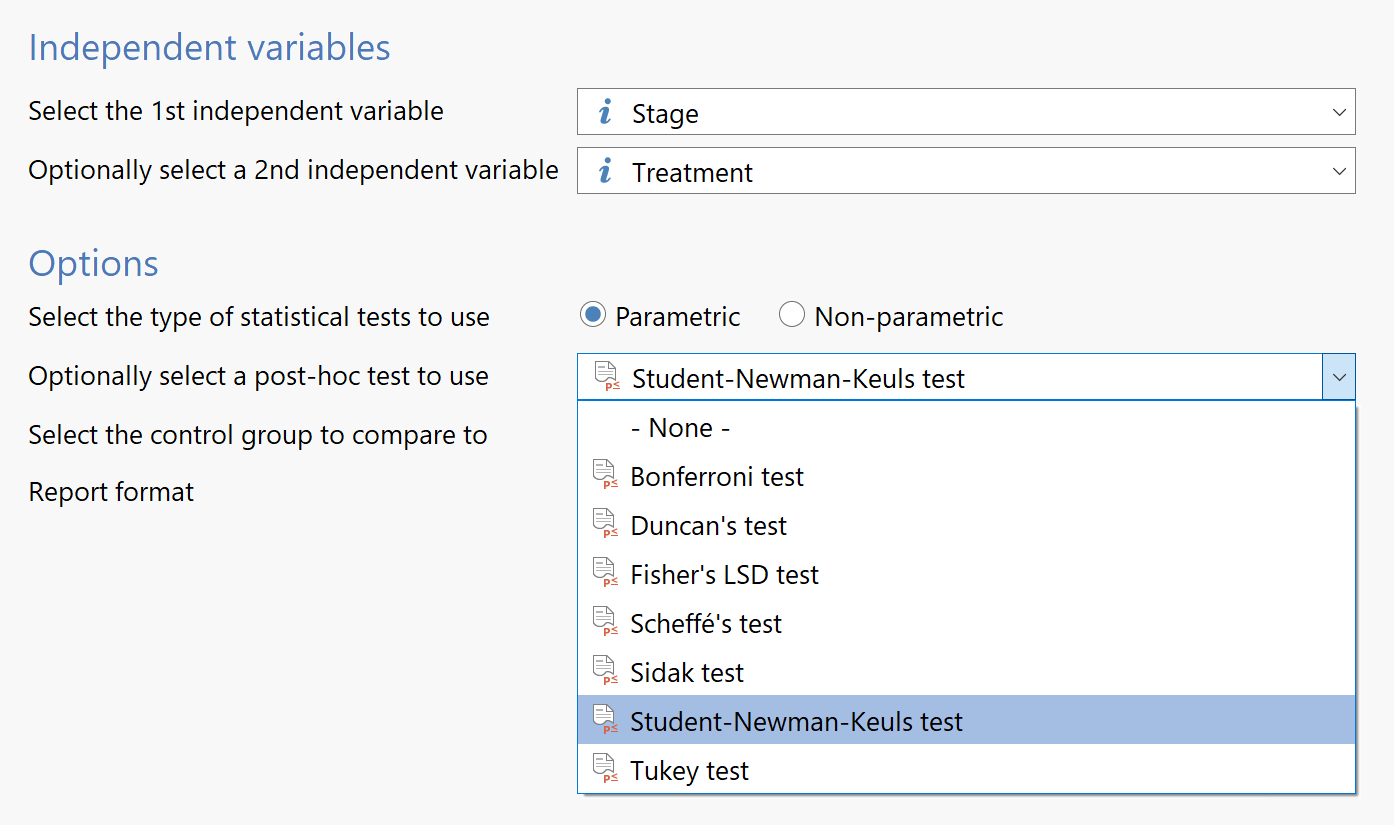
Perform statistical analysis
ANY-maze includes more than 30 parametric and non-parametric statistical tests.
As the system understands the data it’s analysing, it’s able to choose the correct test automatically – for example, in the image on the right, ANY‑maze will use a 2-way ANOVA with one repeated measure (stage).
Analysis features
- Group results by treatment group, stage, trial, field (such as sex or strain), time period, etc.
- Group at up to three levels, for example, by sex and within sex by treatment
- View mean, standard deviation, standard error and raw data for grouped data
- Create column, line or scatter graphs of grouped data
- Where appropriate graphs can include error bars for SD or SEM
- Analyse data using built-in one- and two-way parametric and non-parametric statistical tests
- Perform post-hoc analysis using a selection of standard post-hoc tests
