 Setting up apparatus
 Video capture & tracking
 Observing behaviour
 Connecting equipment
 Automating complex tests
 Running tests
 Results
 Visualising data
 Analysis
 Transferring data
 Open field
 Water-maze
 Y-maze
 Fear conditioning
 Novel object
 Barnes maze
 Radial arm maze
 Light/dark box
 Operant conditioning
 Zebrafish
 Computers
 Multifunction remote
 Accessories
 Digital interface
 Optogenetic interface
 Synchronisation interface
 Relay interface
 Audio interface
 Touch interface
 Analogue interface
 USB TTL cable
 Animal shocker
 Components
 Place preference
 ANY-box
 T-maze
 Zero maze
 Hole board
 Sociability cage
 OPAD
OPAD RAPC
RAPC Waterwheel forced swim test
 Thermal gradient ring
 Operon
 Activity Wheel
 Full ANY-maze licence
 Other licence types
 Developing countries licence
 Contact support
 Support Policy
 FAQs
FAQs Guides
 Downloads
 Send us files
 Activate a licence ID
 Documentation
 Contact us
 Blog
Blog About
About Testimonials
 Privacy Policy
Automation of the Y-maze requires accurate detection of arm entries and often involves analysis of the sequence of movements between the arms
ANY-maze provides both these features. Whole body tracking ensures arm entries are scored in a way analogous to the traditional four-paws-in-the-arm rule, while sequences provide a mechanism to automatically score such things as spontaneous alternations. Full details can be found on the Benefits tab, below.
On the other tabs you'll find videos of Y-maze tests, recommended equipment and a list of results that are especially useful in this test.
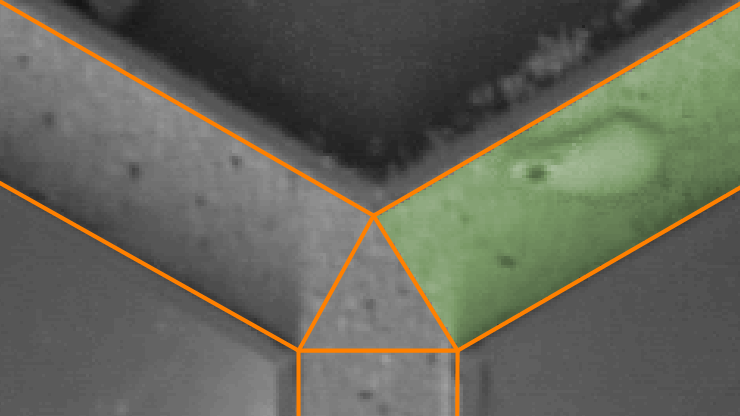
Accurate scoring of arm entries
A key element of tests in the Y-maze is analysis of the sequence of movements between the arms. But if arm entries aren’t scored accurately then any such analysis will clearly be incorrect.
ANY-maze’s whole body tracking allows you specify precisely when an arm entry should be scored. For example, specifying an arm entry as occurring when 80% of the animal’s body is in the arm, equates very well with the traditional four-paws-in-the-arm rule.

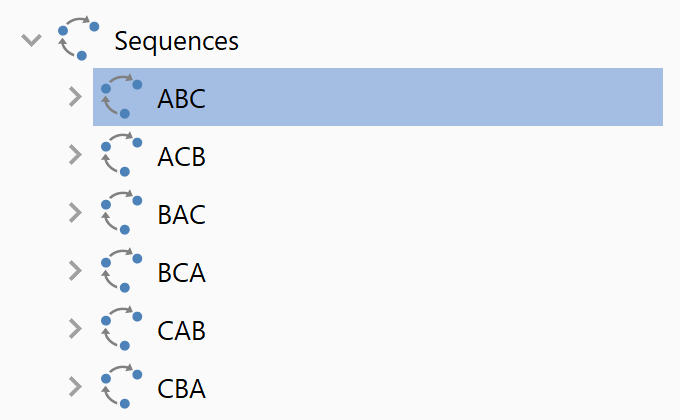
Scoring movements between arms
ANY-maze includes the ability to define sequences, which as the name implies, detect sequences of movements between different parts of the maze.
In the Y-maze, sequences, together with calculations, can be used to automatically score behaviours such as spontaneous alternations.
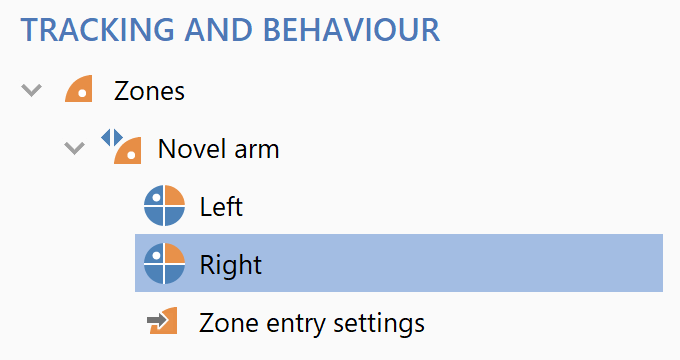
Flexible zone designs
In some Y-maze paradigms, the animals are denied access to one of the arms during their first exposure to the maze and then allowed access to this ‘novel’ arm during a subsequent test.
It’s common to balance the arm that is blocked between treatment groups, so for some animals it will be on the left, while for others it will be on the right. This video shows how easy it is to set up zones like this in ANY-maze.
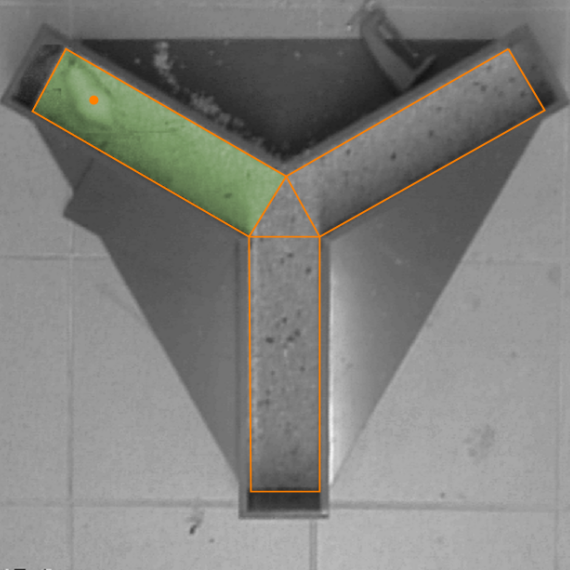
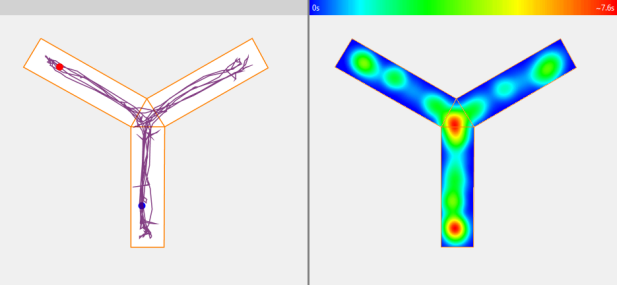
Viewing the animal's track
ANY-maze can plot the animal’s track as a line or as a heat map.
Heat maps indicate how much time the animal spent in different parts of the apparatus and can either show data for individual tests (as shown here) or averaged data for different groups.
In this example, we can see that the animal spent most time at the end of the start arm and in the centre of the maze.
Results
ANY-maze can provide literally hundreds of results for any test, but some of those that are commonly used in the Y-maze include:
- Time in each of the arms
- Number of entries into each of the arms
- Sequential list of arm entries
- Spontaneous alternations
- Total distance travelled

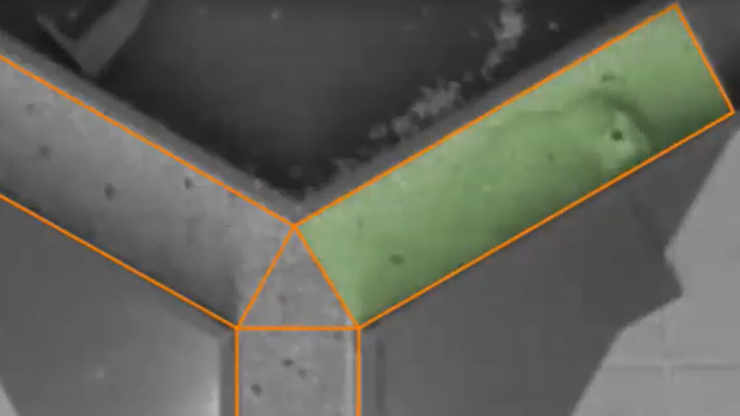
Tracking a white mouse on sawdust
In this example a white mouse with a small black skull cap is tracked in maze in which the arms are filled with sawdust.
There’s not much contrast between the mouse and the sawdust, but this doesn’t prevent ANY-maze from accurately tracking the whole body of the animal and correctly scoring arm entries, even when the animal rears in the central area.
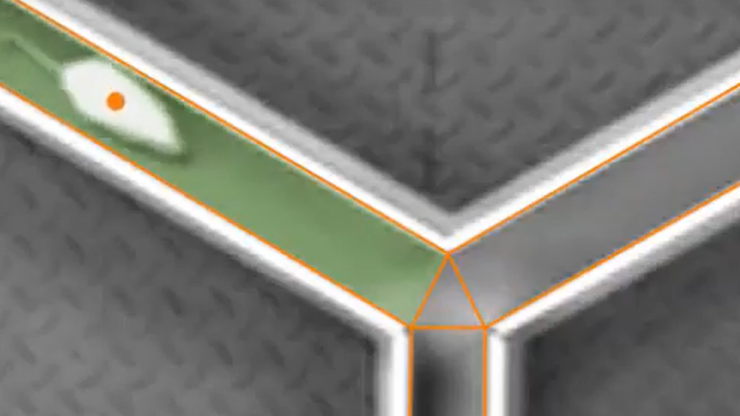
Tracking a white mouse
This example shows a white mouse being tracked in a grey Y-maze. Here ANY-maze is showing the centre point of the animal, but is scoring the arm entries using the entire body of the mouse.
Mazes
We manufacture our own Y-mazes, both for Rat and Mouse. The non-reflective solid metal base plate is painted grey to provide good contrast with almost any animal and the walls simply lift off for easy cleaning.
View more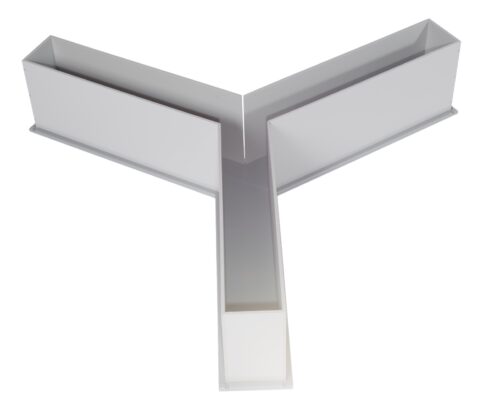
Cameras
USB Camera
The ANY-maze USB camera is an excellent choice for the Y-maze. We recommend fitting this camera with a varifocal (zoom) lens, so you can simply mount the camera on the ceiling and then zoom in and out until the maze nicely fits the camera's view.
View more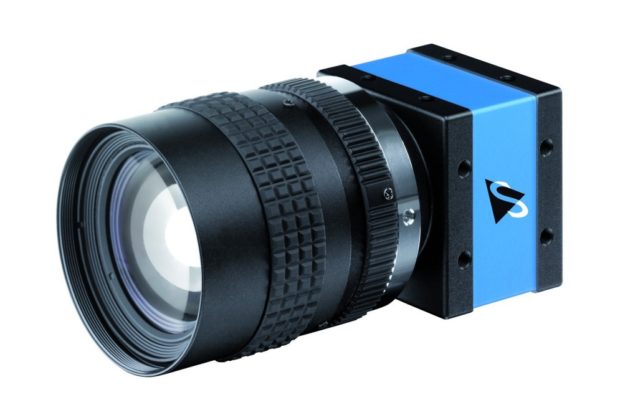
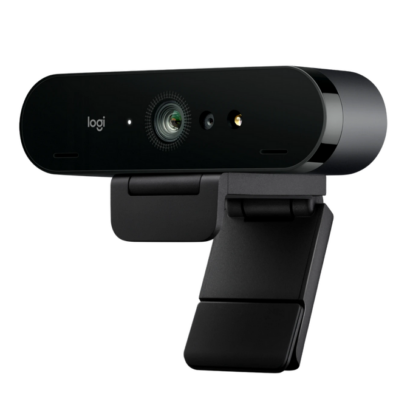
Web cam
A webcam is usually a good, and inexpensive, alternative choice for the Y-maze. If you intend to test in normal lighting conditions (>= 100 lux) and you can mount the camera far enough from the maze for it to see it all, then a webcam should work well.
Lighting
Infrared illuminator
If you intend to track in low light (< 10 lux) or in darkness, then you may wish to use an infrared illuminator and an infrared sensitive camera (most cameras are IR sensitive).
View more
Accessories
ANY‑maze Radio remote control
The ANY‑maze Radio remote control provides a convenient way to start the test as soon as the animal is in the maze. This remote works through walls and has 2 buttons, allowing you to control two apparatus independently.
View more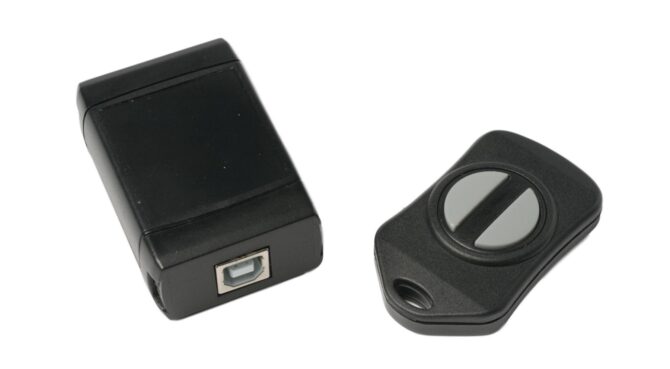
Vijayan, M. et al (2021). Protective effects of a small molecule inhibitor, DDQ against amyloid beta in Alzheimer’s disease. Mitochondrion, 59, 17-29.
Wang, H. et al (2021). Ginsenoside Re protects against chronic restraint stress‐induced cognitive deficits through regulation of NLRP3 and Nrf2 pathways in mice. Phytotherapy Research.
Brinza, I. et al (2021). Bay Leaf (Laurus Nobilis L.) Incense Improved Scopolamine-Induced Amnesic Rats by Restoring Cholinergic Dysfunction and Brain Antioxidant Status. Antioxidants, 10(2), 259.
Thapak, P. et al (2020). Amelioration of diabetes-induced cognitive impairment by Transient Receptor Potential Vanilloid 2 (TRPV2) channel inhibitor: Behavioral and mechanistic study. Neurochemistry international, 139, 104783.
Piña, R. et al (2020). Atomoxetine reestablishes long term potentiation in a mouse model of attention deficit/hyperactivity disorder. Neuroscience, 439, 268-274.
Ueno, H. et al (2019). Comprehensive behavioral study of the effects of vanillin inhalation in mice. Biomedicine & Pharmacotherapy, 115, 108879.
Zimmer, M. R. et al (2019). Activation of Agrp neurons modulates memory-related cognitive processes in mice. Pharmacological research, 141, 303-309.
W.S. Kim et al. (2018) Effect of Fluvoxamine on Amyloid-β Peptide Generation and Memory; Journal of Alzheimer’s Disease 2018; 62(4):1777-1787
S. Rom et al. (2018) Hyperglycemia-Driven Neuroinflammation Compromises BBB Leading to Memory Loss in Both Diabetes Mellitus (DM) Type 1 and Type 2 Mouse Models; Mol Neurobiol 2018; 1-14
M. Van Can et al. (2018) Willughbeia cochinchinensis prevents scopolamine-induced deficits in memory, spatial learning, and object recognition in rodents; Journal of Ethnopharmacology 2018; 214:99-105
D.J. Apicco et al. (2018) Reducing the RNA binding protein TIA1 protects against tau-mediated neurodegeneration in vivo; Nature Neuroscience 2018; 21:72-80
M. Campolongo et al. (2018) Sociability deficits after prenatal exposure to valproic acid are rescued by early social enrichment; Molecular Autism 2018; 9:36
Almeida-Suhett, C. P. et al (2017). Behavioral changes in male mice fed a high-fat diet are associated with IL-1β expression in specific brain regions. Physiology & behavior, 169, 130-140.
EA Zubkov et al. (2017) Prenatal exposure to brain-specific anion transporter-1-specific monoclonal antibodies impairs cognitive function in post-natal life Neuropeptides, 2017 S0143-4179(17)30022-7
Rudyk CA, et al. (2017) Age and Chronicity of Administration Dramatically Influenced the Impact of Low Dose Paraquat Exposure on Behavior and Hypothalamic-Pituitary-Adrenal Activity. Front. Aging Neurosci. 9:222.
Hermes, Gretchen, et al. (2016) Role of mitochondrial uncoupling protein-2 (UCP2) in higher brain functions, neuronal plasticity and network oscillation. Molecular Metabolism (2016).
Qiu, Jing, et al. (2016) Decreased Npas4 and Arc mRNA Levels in the Hippocampus of Aged Memory-Impaired Wild-Type But Not Memory Preserved 11ß-HSD1 Deficient Mice. Journal of neuroendocrinology 28.1 (2016).
Nesil T, et al. (2015) Nicotine attenuates the effect of HIV-1 proteins on the neural circuits of working and contextual memories. Molecular brain 8.1 (2015): 43.
Ciobica, Alin, et al. (2012) The effects of pergolide on memory and oxidative stress in a rat model of Parkinson’s disease. Journal of physiology and biochemistry 68.1 (2012): 59-69.
Shin MK, et al (2011) A novel trimeric peptide, Neuropep-1-stimulating brain-derived neurotrophic factor expression in rat brain improves spatial learning and memory as measured by the Y-maze and Morris water maze. J Neurochem. 2011 Jan;116(2):205-16.
Palanisamy, Arvind, et al. (2011) Rats exposed to isoflurane in utero during early gestation are behaviorally abnormal as adults. The Journal of the American Society of Anesthesiologists 114.3 (2011): 521-528.
Schweizer, Martin C., Markus SH Henniger, and Inge Sillaber. (2009) Chronic mild stress (CMS) in mice: of anhedonia,‘anomalous anxiolysis’ and activity. PloS one 4.1 (2009): e4326.