 Setting up apparatus
 Video capture & tracking
 Observing behaviour
 Connecting equipment
 Automating complex tests
 Running tests
 Results
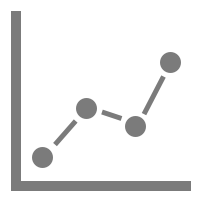 Visualising data
 Analysis
 Transferring data
 Open field
 Water-maze
 Y-maze
 Fear conditioning
 Novel object
 Barnes maze
 Radial arm maze
 Light/dark box
 Operant conditioning
 Zebrafish
 Computers
 Multifunction remote
 Accessories
 Digital interface
 Optogenetic interface
 Synchronisation interface
 Relay interface
 Audio interface
 Touch interface
 Analogue interface
 USB TTL cable
 Animal shocker
 Components
 Place preference
 ANY-box
 T-maze
 Zero maze
 Hole board
 Sociability cage
 OPAD
OPAD RAPC
RAPC Waterwheel forced swim test
 Thermal gradient ring
 Operon
 Activity Wheel
 Full ANY-maze licence
 Other licence types
 Developing countries licence
 Contact support
 Support Policy
 FAQs
FAQs Guides
 Downloads
 Send us files
 Activate a licence ID
 Documentation
 Contact us
 Blog
Blog About
About Testimonials
 Privacy Policy
ANY-maze tracks an animal’s movement by recording XY coordinates for each frame, compiling the tracking data into hundreds of useful measures like Distance traveled and Average speed. However, you may need access to these raw coordinates for external analysis. The raw tracking coordinates and other test-related events can be exported in a “Test data report,” which this guide will cover in detail—explaining how to customize, export, and interpret the report.
Section 1
View, edit, and export your report
To view the XY coordinates for a test:
- Open your Experiment file and navigate to the Tests page.
- Select a test number from the Test schedule on the left.
- Then at the top of the page select Related reports > Test data report.
By default, the report includes XY coordinates and zone entry data. To modify this content, click the “Test data report” link or go to Protocol > Test data report at the bottom of the Protocol list. On this page, you can select or deselect measures to customize the report, adjust the time format, and select whether animal positions are displayed in pixels or millimeters relative to the origin (the top-left pixel of the video frame).
Once satisfied, you can export the report by clicking “Save” at the top of the page. Or, to export the report for all tests, select File > Export > Export test data.
After exporting, it’s essential to consider certain nuances when evaluating the test data report. The following sections will clarify important distinctions to help you interpret the report accurately.
Section 2
Analysis of Events and States
The Test data report can include numerical data, such as the animal’s speed or body rotations, and categorical data like events and states (e.g., shocker activation or zone occupancy). If you’ve populated your report with the latter, then it’s important to understand the distinction between ‘events’ and ‘states’.
An event is something that happens at a specific moment in time, like a pellet dispenser dispensing a pellet —it’s a distinct, instantaneous occurrence. A state, on the other hand, is a condition or status that persists over a period, such as an animal remaining within a zone or a light remaining on. Events are listed in past tense (e.g., “Pellet dispenser dispensed pellet”), while states are noted in present tense (e.g., “Shocker active”).
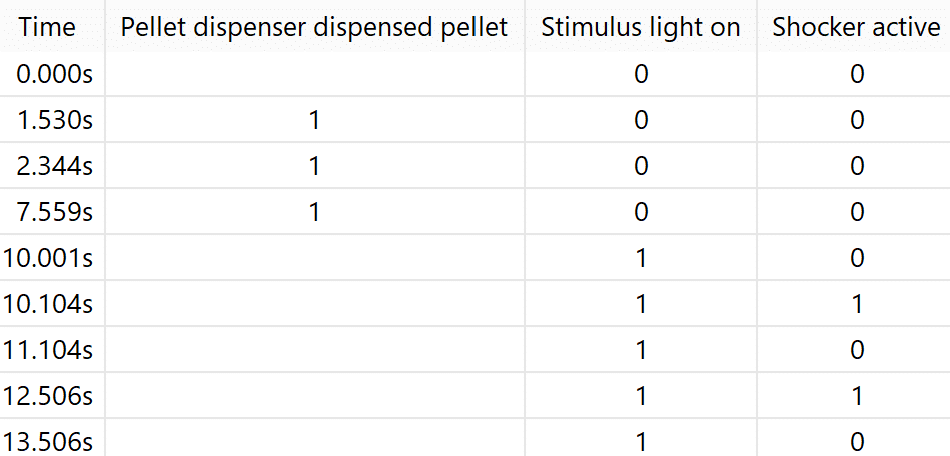
As you can see in the example report below, states and events are reported slightly differently to one another. For states, a continuous sequence of 1’s means the state description is ‘true’ during that period, and a sequence of 0’s means the state is ‘false’. For instance, the stimulus light is off from 0.000-10.001s, when it finally turns on.
Events, on the other hand, display a “1” each time the event occurs, without suggesting an ongoing status. In the report below, the pellet dispenser dispensed a pellet at 1.530s, another pellet at 2.344s, and a 3rd pellet at 7.559s. It is NOT the case that the pellet dispenser was on from 1.530-7.559s.
The next section will outline considerations when evaluating numerical data – in particular, Distance travelled and Average speed.
Section 3
Analysis of Distance travelled and Average speed
After exporting your report, you might determine the distance between each coordinate and sum them up to calculate the distance the animal travelled. You could then divide this by the test duration to find the average speed throughout the test. But when you compare these two results with the Total distance travelled and Average speed results produced by ANY-maze, you’ll probably find they don’t agree. Why is that?
The distance the animal travelled is processed in such a way as to remove small movements, such as you would see if the animal were to shuffle about in a corner of an open field. For example, imagine the animal spent an entire test sitting in the corner of an open field grooming, scratching and perhaps turning around. Asked how far the animal had travelled during the test, an observer would probably answer ‘not at all’, as the animal didn’t move from its starting location. However, the orange tracking dot would have moved a little, probably oscillating from side to side while the animal groomed or scratched and perhaps describing a small circle when the animal turned.
Strictly speaking all these small movements could be added together and we might say that the animal had moved, perhaps, 100cm during the test – but that would seem to be at odds with what an observer would report, because for sure, the animal didn’t ‘travel’ 100cm. So, the key point here is that the distance the animal travelled does not include all these small movements, rather it sums the distances travelled as the animal moves from place to place in the apparatus.
The Speed column of the Test data report shows the instantaneous speed of the animal – that is to say, the speed the animal is moving ‘right now’. The way this speed is calculated is by taking the distance the animal has moved since we last determined its location and dividing it by the time that has elapsed since we last determined its location. However, this doesn’t make any distinction between different ‘types’ of movement.
For example, returning to our animal which sat in the corner of the apparatus and didn’t ‘go anywhere’, we will see small movements – for example, between one picture from the camera and the next the animal might move 2mm to the left. Assuming the camera is providing 30 pictures per second this would mean the animal moved at a speed of 0.002/0.033 = 0.06m/s and ANY-maze would report this as the animal’s instantaneous speed (in fact these values have a short moving average applied to them as this avoids artefacts caused by the way the data is being sampled). If the animal then moved 2mm back to the right, it would still be moving at 0.06m/s but would now have returned to where it started. If it repeated this pattern throughout the entire test, then the instantaneous speed would be 0.06m/s throughout the test and so the average of the speed column on the Test data report would be 0.06m/s. However, the animal simply kept moving 2mm left, 2mm right and then back again, so it didn’t go anywhere. The total distance travelled would therefore be 0m and so the Average speed measure would be 0m/s.
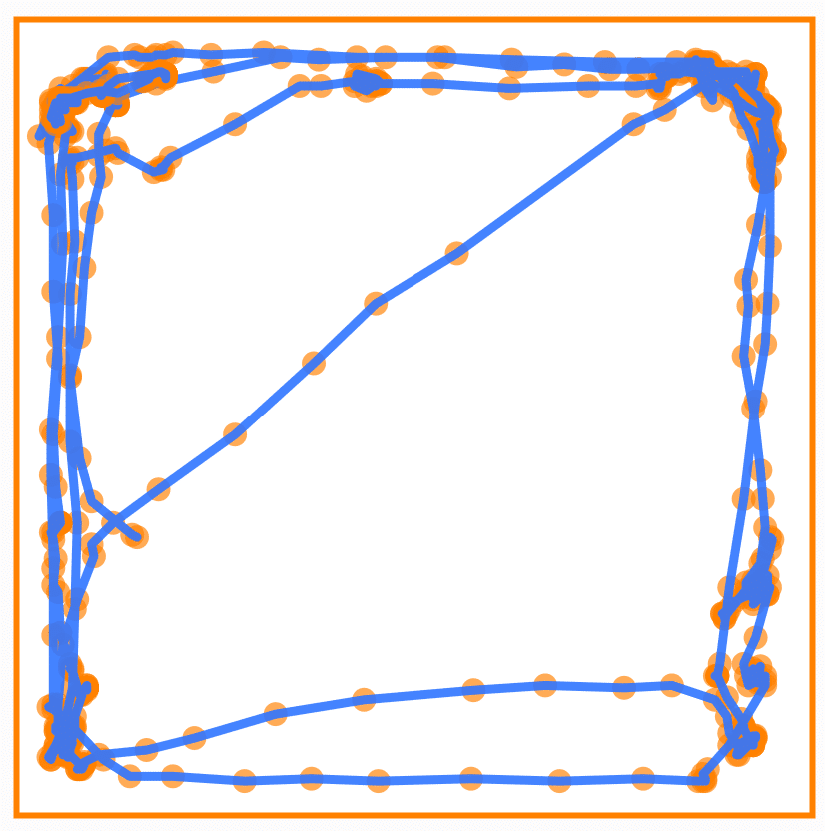
In reality, of course, an animal will actually both move around in the apparatus and stop and ‘move’ in-place. Looking at the chart below, which shows an animal’s instantaneous speed during a 1 minute 30 second open field test, we can see that there are obvious peaks where the animal is moving quite quickly, but there are also periods, especially towards the end of the test, where the animal is moving very slowly, and these are actually ‘in-place’ movements. I know this because I have watched the test – but they could be movements from place-to-place, in that the animal could have just walked very slowly across the apparatus. So, the point here is that in this instance, averaging the instantaneous speed will include these values (effectively taking the area under the graph and dividing it by the test duration), whereas the Average speed measure will ignore them, as the animal didn’t actually ‘move’ any distance.

In summary, both the Average speed, as a strict distance divided by time value, and the Instantaneous speed are correct – but they report slightly different things and are useful for different purposes.
Calculating the average of the Speed column in the Test data report will not necessarily report the average instantaneous speed correctly. The reason for this is because the values are not necessarily spaced evenly through time (if they were, then a simple average of the values would yield the correct value). For example, consider the following data:
| Time | Speed |
| 0s | 0m/s |
| 1s | 4m/s |
| 5s | 1m/s |
| 6s | 1m/s |
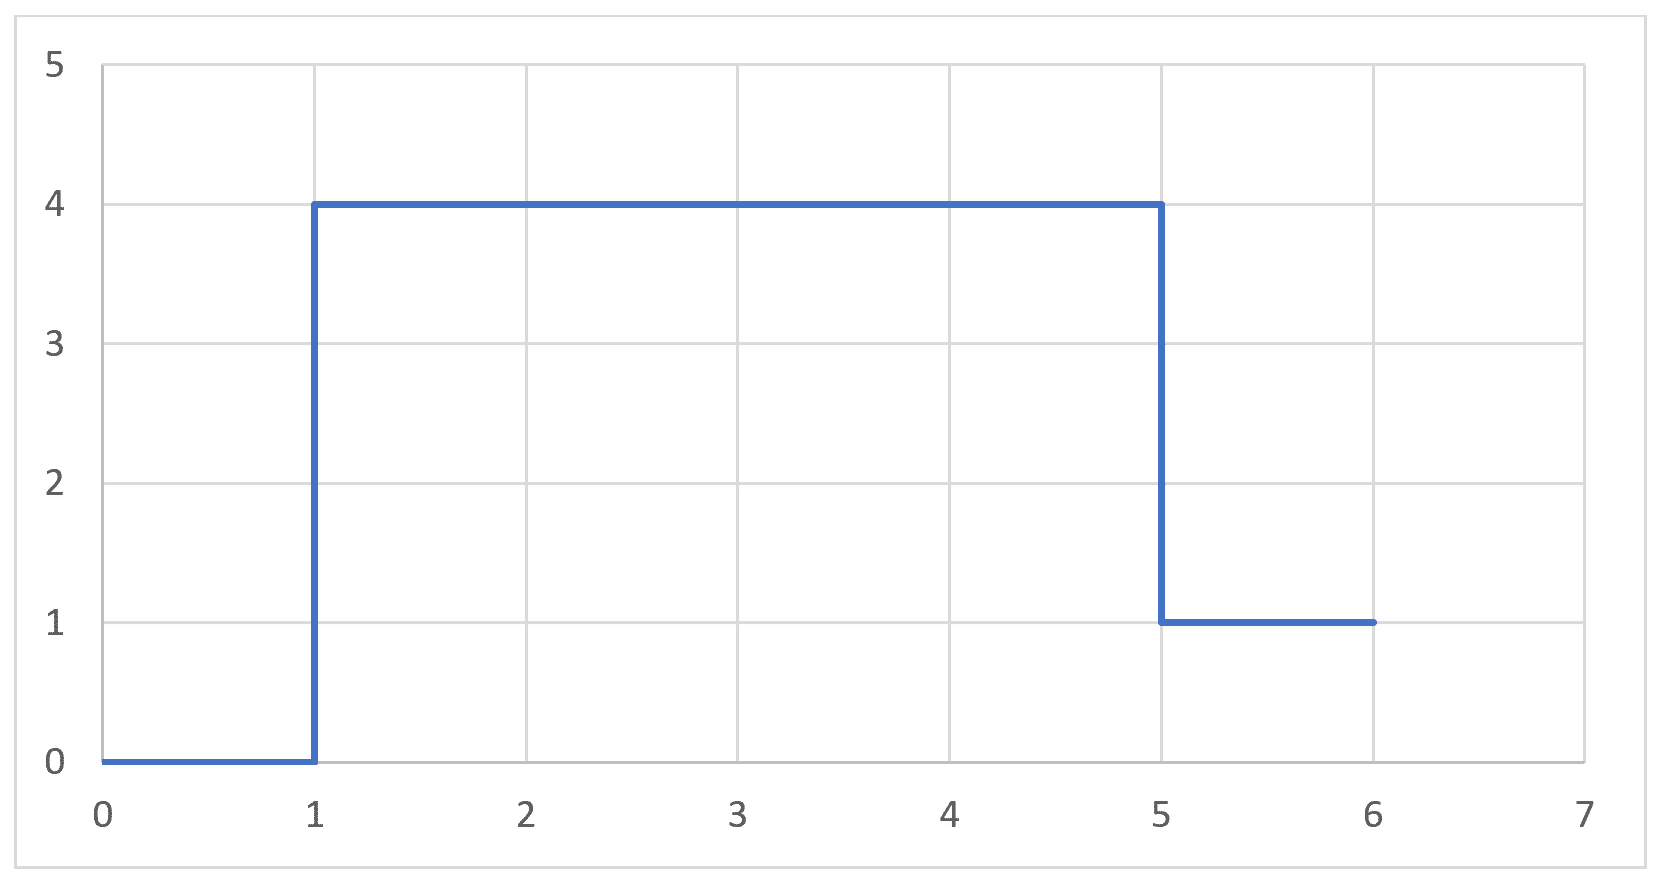
A simple average of the values (1.5m/s) fails to account for the 4-second gap between the first and second values. How to account for this is open to interpretation. The above data could be plotted like this:

If we then calculate the area under the curve we get 13 and dividing by the duration (6) gives 2.17m/s, which is a more correct average value.
In fact, the graph below is also factually correct (the speed at each time point is the value given above) but here we assume the speed is the value we determined until we have a new value. As can be seen, calculating the area under this graph will yield a different ‘average’ value (2.83m/s).
Although this example makes these differences appear quite stark, they are usually quite small, but the point is that calculating the average of the instantaneous speed data is not quite as simple as it might appear.
As illustrated, accurately interpreting distance travelled and average speed involves careful analysis of time gaps and movement patterns. Though these differences may seem subtle, understanding them helps in using the data for meaningful insights into an animal’s movement behavior.
Section 4
Summary
ANY-maze’s Test data report enables granular analysis of an animal’s behavior, offering customizable metrics such as XY coordinates, speed, and categorical data. Understanding the difference between events (single occurrences) and states (ongoing conditions) is essential for interpreting the report accurately. And when assessing metrics such as distance traveled and average speed, it’s important to know that ANY-maze filters out minor, in-place movements, offering a realistic analysis of movement to better represent the animal’s true locomotion patterns.
For questions about the Test data report, please don’t hesitate to email us at [email protected].