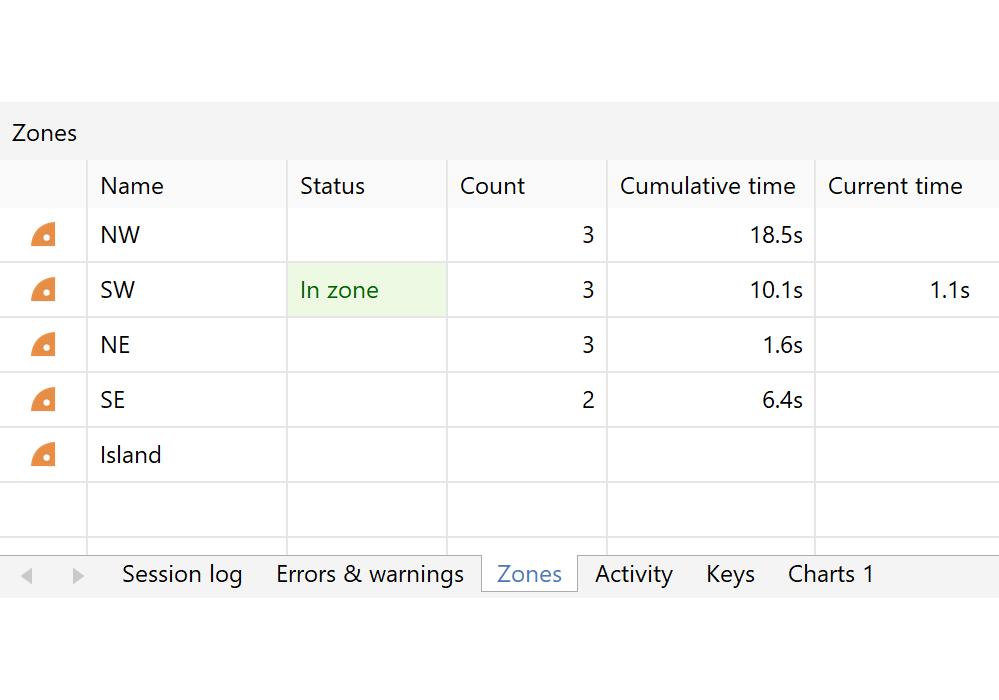
Version 7.00 is a major update to ANY-maze and includes a wide range of new features and improvements; check out all the details below.
Test page panels
On the Tests page, real-time information about tests is now displayed in a series of panels.
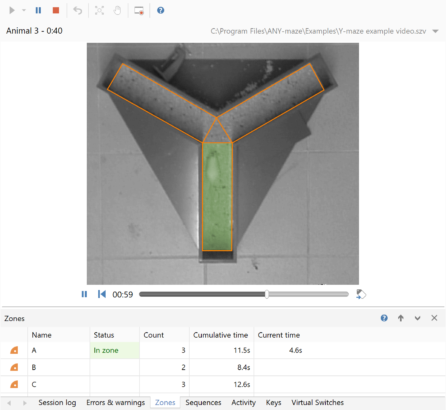
In this example, the Video panel is ‘promoted’ (so it is always visible), and the other panels are selectable through the tabs at the bottom of the page.
A wide range of panels are available, including panels to show:
- The video picture of the apparatus
- Details of zones and sequences
- The state of inputs and outputs
- Behaviours (such as freezing)
- Charts
- Keys being used to score behaviours
The keys panel not only shows the state of any keys you are using to score behaviours, but also allows you to layout your own virtual keys for use with a touch screen, as in the image below.
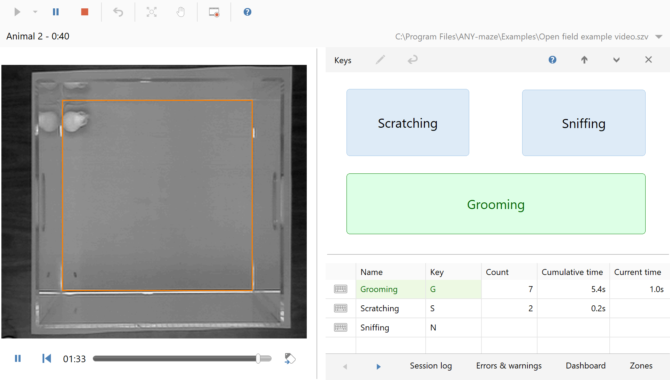
Other panels include a Session log, which can show a wealth of information about the tests you’re performing, and an Errors and warnings panel which reports issues that could affect the tests, for example, a pellet dispenser running out of pellets, or a disk getting full while recording a video.
All the panels provide real-time information during tests. For example, the I/O panel shows you live information about all inputs and outputs, such as what sound a speaker is playing and how much longer it will play for, whether a shocker is on or off, how many pellets a pellet dispenser has dispensed so far, etc.

Panels can be shown or hidden, and reorganised to suit your own preferences and requirements.
ANY-maze Operant interface
ANY-maze version 7 adds support for the new ANY-maze Operant interface, pictured below. This device provides a simple way to control the broad range of operant equipment available from Med Associates, Inc.
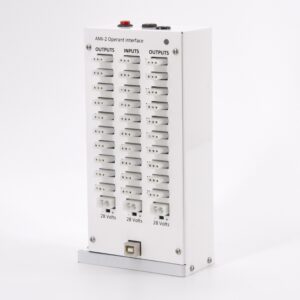
Standard operant components, such as levers, lights, pellet dispensers, etc. plug straight into the interface, which connects directly to the PC via USB.
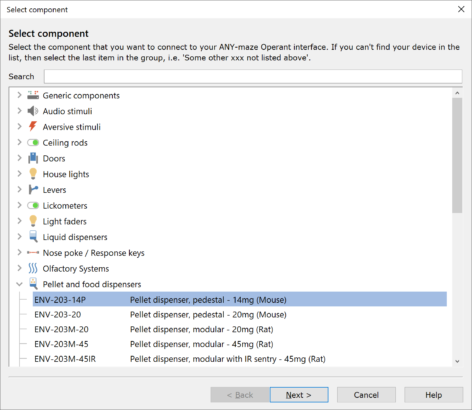
You can tell ANY-maze about the components you have connected using a user-friendly configuration window and it then automatically adds all the components into your protocol ready to use.
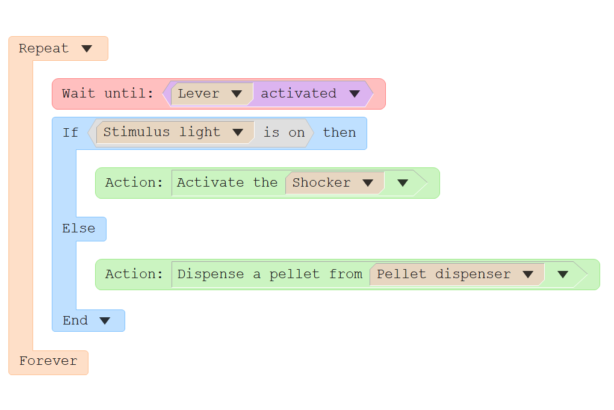
ANY-maze’s easy-to-use but powerful procedures can then be used to define how you’d like the components to work in your tests. In the example below, the procedure will either deliver a shock or a pellet, depending on the state of the stimulus light.
ANY-maze seamlessly supports multiple Operant interfaces. For example, if you have 20 operant cages, then you can easily configure all the interfaces for all the cages simultaneously and then add them all to your protocol in one go.
Investigation zones
In version 7 we have introduced Investigation zones. These are zones which the animal is deemed to be investigating if: it is within a certain distance of the zone, and (optionally) is oriented towards the zone, and (again optionally) is not actually inside the zone.
ANY-maze will report lots of measures, such as how often the animal investigated the zone, for how long, what the latency to investigation was, etc.
This new feature is especially useful in the Novel Object Recognition Test – see the picture below – but it can be used in any situation where you want to know how much time the animal spends investigating a part of the apparatus.
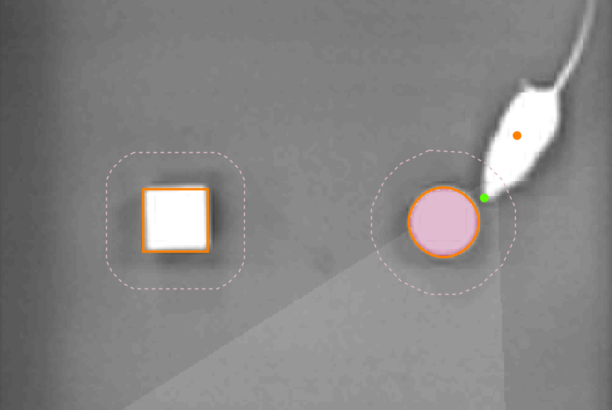
Here, the animal is ‘investigating’ the object because: its head is within 25mm of it (the dotted line shows the investigation area), it is oriented towards the object (the flashlight-like beam shows the orientation) and it is not on top of the object.
As part of the work on investigation zones, we also improved how ANY-maze shows the animal’s orientation. As can be seen in the figure above, orientation is now indicated by something like a flashlight beam; ANY-maze considers the animal to be oriented towards anything this beam touches. You can specify the width of the beam, thus controlling how loose or tight the definition of orientation is.
Track plots and heat maps have been completely redesigned
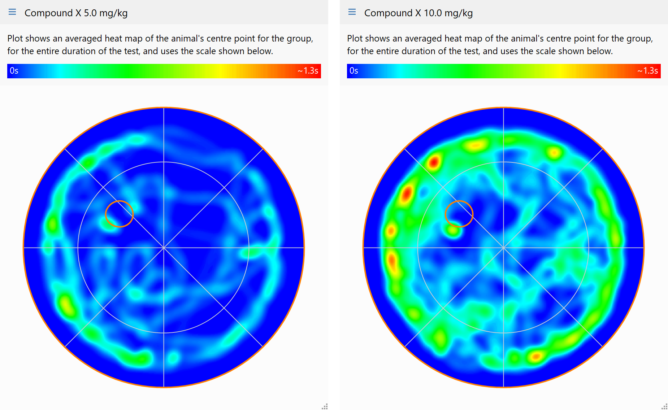
In version 7 we have redesigned heat maps and track plots and incorporated many customer requests and suggestions.
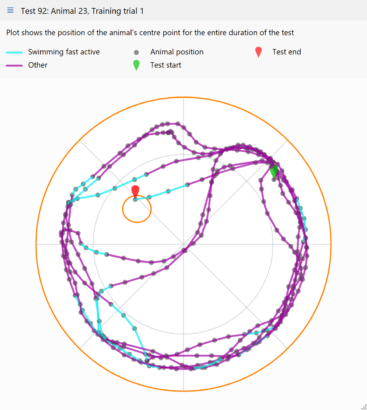
- Track plots and heat maps can now be resized simply by dragging the corner.
- Both track plots and heat maps can include markers showing where specific events, such as rearing, occurred.
- They can also both be created for an entire test or any time segments (aka time bins), or time periods.
- Tracks can be colour coded, for example, to show when the animal was moving quickly.
- Heat maps can now be created for a wider range of things, such as where specific behaviours such as freezing, immobility, rearing, etc. occurred.
- Track plots can include a still image of the apparatus as their background, or can use a heat map as a background, creating a hybrid track plot and heat map.
- Track plots and heat maps are much faster – it’s entirely viable to plot them for any duration, even for tests that last a week or more.
- You now have much more control over the format of plots; for example, the colours of lines, markers and tracks can all be altered, as can track thickness, transparency, etc.
- Plots can be edited dynamically using a simple pop-up window.
- You can define any number of different track plots and heat maps within the protocol.
- It is now possible to specify geometric transforms that should be applied to track plots and heat maps so that they align with one and other – this is especially useful when plotting group average heat maps.
Improved tracking
We’re always working on the tracking in ANY-maze and in version 7 we have made a number of improvements especially to head tracking, which now works well even in low contrast or poor quality images (although it is still limited to tracking the heads of rodents).
Check out the video below, where ANY-maze version 7 robustly tracks the animal’s head, despite the chequered background and the low image quality.
Of course we appreciate that you won’t want to change the tracking system in the middle of an experiment, or even between experiments (if you’re running a series of experiments and plan to compare their results), so you can choose whether ANY-maze should use the old version 6 tracking engine or the new one from version 7.
Improved and simplified freezing detection
In V7 freezing detection has been simplified by removal of the old freezing threshold values. ANY-maze now determines the freezing threshold automatically, although you can adjust the sensitivity (i.e. how much movement is acceptable while still considering the animal to be freezing) to suit your experiment.
Again, we’ve included an option to use the old version 6 freezing detection method if you wish.
ANY-maze now highlights errors and warnings in your protocol
In version 7 the protocol list now shows error and warning markers to highlight parts of the protocol that might need your attention. Pointing at a marked item will pop-up a message explaining what the issue is – see the image below.
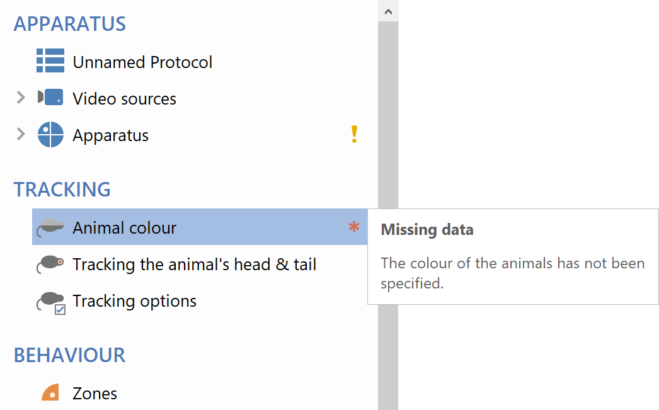
A great thing about the error markers is that when you first create a protocol all the compulsory elements are marked (because they’re missing data), so you can easily see the minimum that you need to do to make your protocol usable.
Performance improvements
We’ve done lots of work under-the-hood in version 7 to make it run faster and smarter. It now takes full advantage of the latest microprocessors and also uses the computer’s graphics processor where it can. The upshot of this is that you will find that ANY-maze starts-up more rapidly, results are analysed faster and reports open more quickly – even if you have lots of apparatus and long duration tests.
Other new features and improvements
- We’ve made it easier to switch between videos from the Tests page. For example, if you have an experiment in which all the tests were recorded to individual video files, you can simply open a menu of all the videos and pick the one to track.
- ANY-maze now detects and reports more errors and warnings about things that happen during a test. These are displayed in the new Errors and warnings panel while a test is running and are available in the Test details report after the test has been performed.
- We’ve reorganised the protocol list (on the left side of the protocol page) into a more logical structure.
- We’ve improved the Test page thumbnails, which are really useful when you’re working with lots of apparatus at the same time.
- When setting up a zone, you can now see the real-world area of the zone as well as what percentage of the total apparatus area it represents.
- You can now search your recent experiments on the File page.
- Version 7 supports high resolution monitors up to and beyond 4K. It also copes seamlessly with being moved between multiple monitors even if they have different resolutions and scaling.
- We’ve updated and expanded the range of example experiments. These can be a great place to try new features, as no matter what you do to them examples can’t be permanently changed. For example, if you want to see the new track plots and heat maps in action, just try them in the example water-maze experiment. You can alter the settings as much as you like, they’ll just revert when you close the example.
- There are lots of other minor improvements and adjustments throughout version 7.

 Setting up apparatus
 Video capture & tracking
 Observing behaviour
 Connecting equipment
 Automating complex tests
 Running tests
 Results
 Visualising data
 Analysis
 Transferring data
 Open field
 Water-maze
 Y-maze
 Fear conditioning
 Novel object
 Barnes maze
 Radial arm maze
 Light/dark box
 Operant conditioning
 Zebrafish
 Computers
 Multifunction remote
 Accessories
 Digital interface
 Optogenetic interface
 Synchronisation interface
 Relay interface
 Audio interface
 Touch interface
 Analogue interface
 USB TTL cable
 Animal shocker
 Components
 Place preference
 ANY-box
 T-maze
 Zero maze
 Hole board
 Sociability cage
 OPAD
OPAD RAPC
RAPC Waterwheel forced swim test
 Thermal gradient ring
 Operon
 Activity Wheel
 Full ANY-maze licence
 Other licence types
 Developing countries licence
 Contact support
 Support Policy
 FAQs
FAQs Guides
 Downloads
 Send us files
 Activate a licence ID
 Contact us
 Blog
Blog About
About Testimonials
 Privacy Policy
